
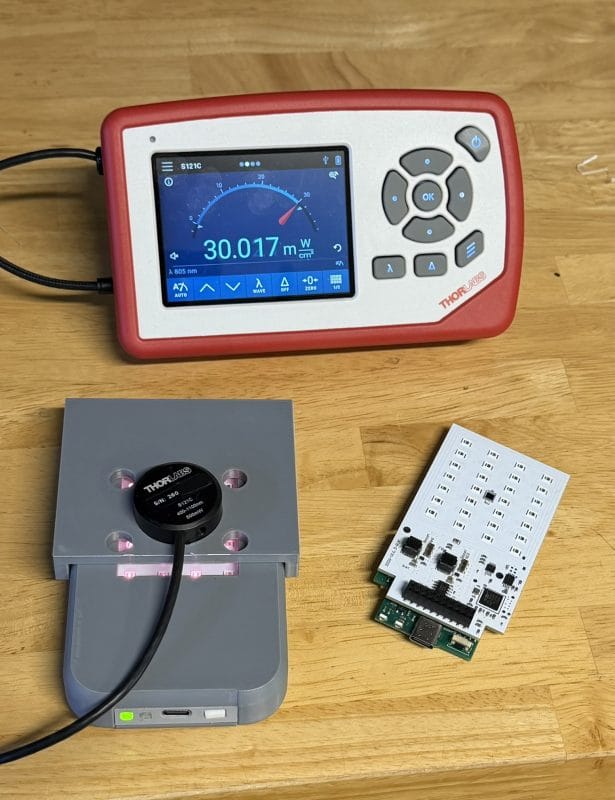
Three things have come together this month that, taken individually, are each meaningful progress. Together, they represent a hardware and software stack that does what it was designed to do: deliver a known, reproducible dose of light — measured in joules, not estimated. In photobiomodulation, dose — not electrical input power and not session duration alone — is the quantity most closely tied to biological response.
This is a build-in-public update. No marketing. Just what’s working, what the numbers look like, and what’s next.
1. PCBs arrived and they work
The new production PCBs came in. I’ve brought up two units so far, and both are functional. That’s an early data point, not a yield number — there are more to validate — but the critical path items check out: LED driver behavior, NFC session logging, the reflected optical contact measurement, wireless charging. No show-stoppers on the first two.
These aren’t prototypes reworked with dead-bug components or jumpered around known issues. They’re the design. That’s a different kind of confidence than hand-modified development hardware.
2. The calibration setup is dialed
Every unit is calibrated with a NIST-traceable optical power meter (Thorlabs PM100D + S121C sensor) before it ships. What’s new is that the process is now automated and repeatable: calibration fixtures locate the device in a repeatable near-contact measurement geometry, a single button press runs the Red and NIR channels across a wide range of operating conditions, and the resulting irradiance values are recorded without manual intervention.
The calibration records from the two validated units look clean. The table below shows full-power output at the calibrated operating geometry, along with the typical derated operating point used during sessions to maintain stability over 10+ minutes.
| Channel | Wavelength | Full power | Typical operating point |
|---|---|---|---|
| Red | 660 nm | ~44 mW/cm² | ~38 mW/cm² |
| NIR | 805 nm | ~34 mW/cm² | ~30 mW/cm² |
| Dual | 660 + 805 nm | ~78 mW/cm² | ~58 mW/cm² |
All measurements are performed in the device’s intended near-contact operating geometry rather than at arbitrary distances. That geometry is the one used during real sessions, so calibration directly reflects delivered dose rather than a laboratory-only measurement condition.
The measurement uncertainty is ±3.6%, which is the instrument-level figure from the Thorlabs calibration chain — what appears on the Thorlabs certificate and defines the achievable accuracy of dose delivery.
3. Temperature compensation is working — better than 2% across a session
LED irradiance drops with junction temperature. In a handheld device used in contact with skin, thermal management matters. The temperature compensation implementation is now working well enough that session-to-session and intra-session variability is expected to remain under 2%, which keeps thermal drift well below the calibration uncertainty of the measurement chain itself.
The compensation model was developed empirically: data was collected across a wide range of starting temperatures and drive current levels, with Red and NIR channels characterized independently. Time was included as a model input. Voltage was evaluated but showed little predictive value and was dropped. From that dataset, exponential functional forms and many parameter combinations were fit and evaluated; terms without strong parameter correlation or physical justification were discarded. The result is a compact, physically grounded model rather than a black box — but the fitting process was systematic enough to resemble applied machine-learning model selection, although the final implementation remains compact and physically interpretable.
To put the result in context: the device’s total measurement uncertainty (instrument ±3.6%) is already the dominant error term. Temperature drift contributing less than 2% means it’s not the limiting factor in dose reproducibility.
One honest caveat: LEDs dim gradually over their lifetime, and that long-term drift is not yet characterized. The calibration is accurate at the time of shipment; over months and years of use, output will drift slowly downward. Recalibration against a traceable reference is the right answer, and offering that as a service is on the roadmap.
Why dose control matters
Most consumer light-therapy devices specify electrical power or treatment time. Rejuvulite specifies delivered optical dose. That distinction only becomes meaningful when output is calibrated and stabilized across the session. This update marks the point where those pieces are working together as a system.
4. The app delivers dose in joules — and it means it
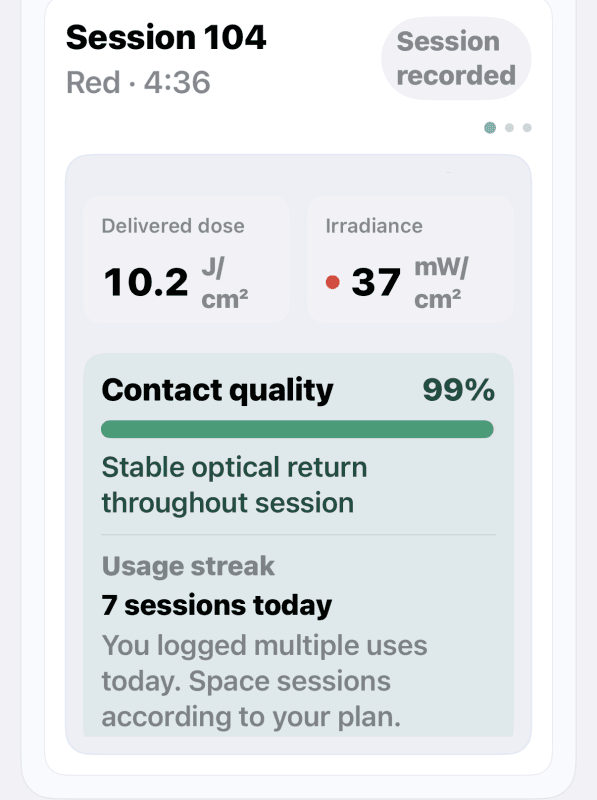
The companion iOS app now lets you select a target dose in joules. The device runs the session and stops when that dose has been delivered, calculated from the calibrated irradiance and the real session time — not a nominal estimate based on LED specifications. This converts the device from a timer into a dose-delivery instrument.
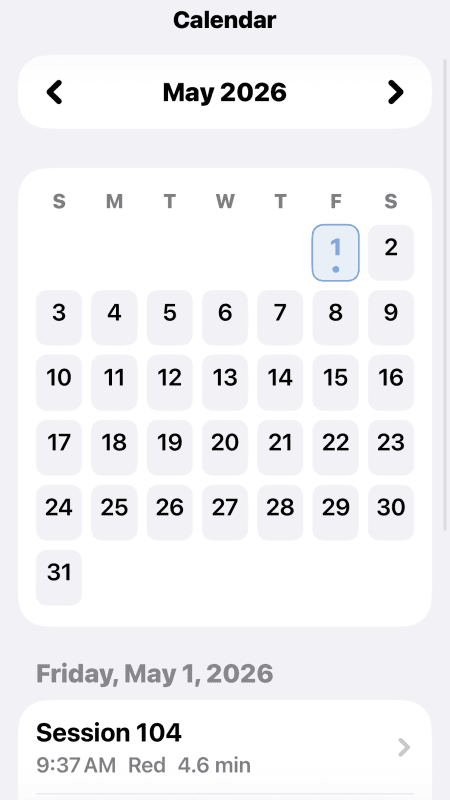
The three screenshots below show how this looks in practice: the session summary with quality score and mode, the Dynamic Optical Response chart showing contact stability over time, and the calendar view where sessions accumulate.
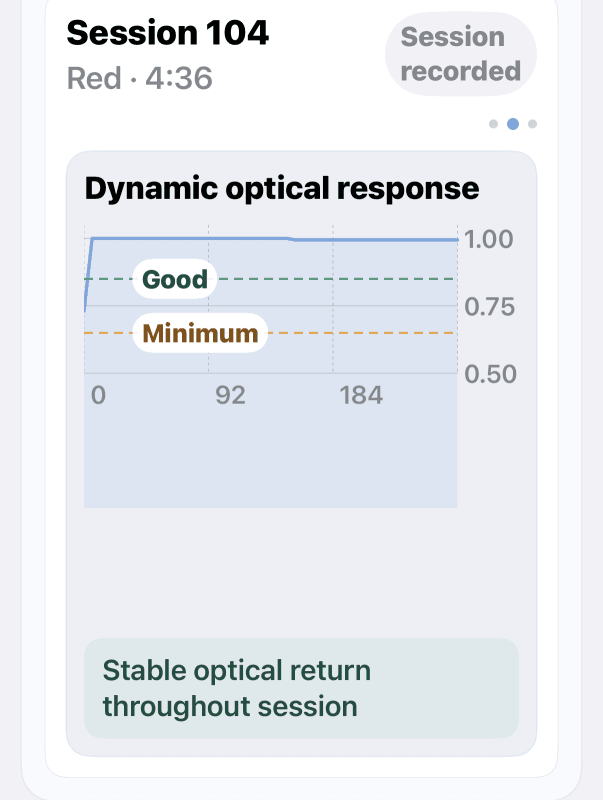
The Dynamic Optical Response chart is worth dwelling on. It plots the normalized optical return from the ambient-nulling reflected measurement system across the session. A stable trace — like the one above, which sits near 1.0 throughout — confirms that contact was maintained and that the irradiance reaching the tissue surface was consistent. A session that wandered wouldn’t look like that.
This isn’t a feature added for differentiation. It’s the natural output of a measurement that was already happening for contact quality gating. Displaying it closes the loop for the user: they can see what the device saw.
Where things stand
- PCBs validated — two units functional, calibration records clean
- NIST-traceable calibration pipeline — repeatable per-unit workflow established
- Temperature compensation — <2% intra-session variability confirmed
- Joule-based dose control in app — target set, delivery confirmed against calibrated irradiance
- Remaining unit validation — three more units to bring up and calibrate
- Calibration certificate format — serial-numbered PDF with full measurement record, published to the Measured Performance page
- Evaluator units — pilot placement with technically credible reviewers, targeting May 2026
The evaluator program places units with people who will use the device seriously and describe what they observe. It’s not a beta test for reliability — the hardware works — it’s structured feedback on real-world use before a broader release.