Measured performance
You read what it’s built to do. Here’s the data confirming it.
Every figure below was measured on production hardware using NIST-traceable instrumentation, rather than relying solely on nominal LED specifications. Each unit ships with its own calibration record, generated the same way.
Most light therapy devices publish a specification. Rejuvulite calibrates every individual unit. The calibration record below is generated from the same NIST-traceable measurement used during production. Individual calibration reduces unit-to-unit variation, so session timing is based on measured output, not assumed output.
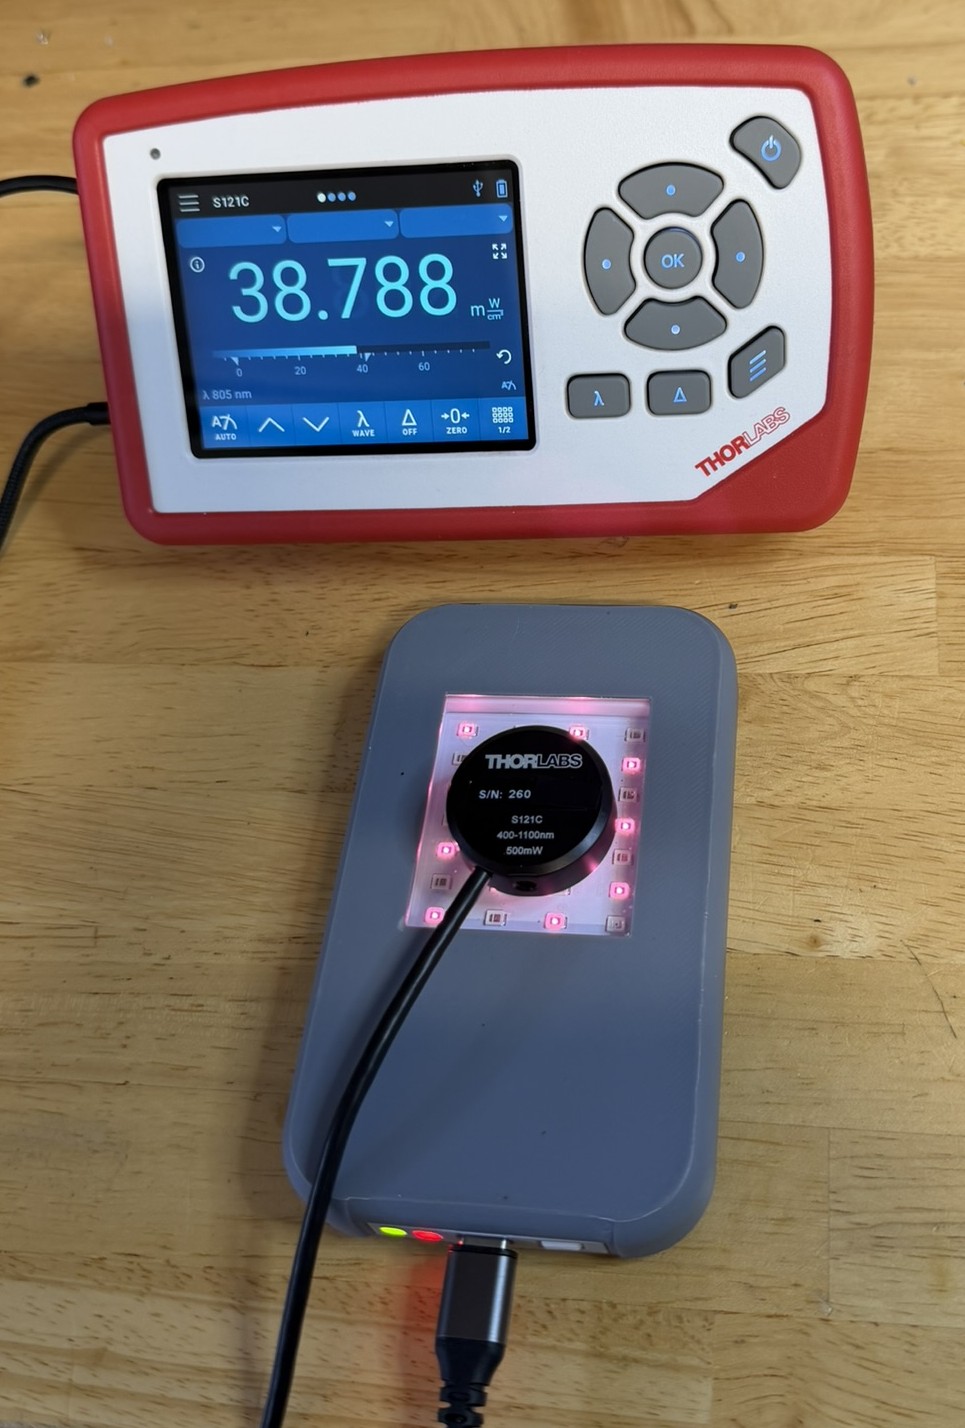
Thorlabs PM100D / S121C, NIST-traceable, 400–1100 nm. The reading is the production measurement — not a target, the result.
Why this matters
A published spec doesn’t tell you what reached your skin
This illustrates the difference between a published specification and a measured, calibrated output — not a comparison to any specific product.
before it ships
typical session output
typical session output
Measured output
What it delivers, per channel
Figures below reflect steady, sustained output during a session — not a peak number measured for a moment and never sustained. Red and NIR are measured independently; combined mode is a derived figure, noted below.
| Mode | Irradiance (mW/cm²) | Dose rate (J/cm²/min) |
|---|---|---|
| 660 nm red | 39.5 | 2.37 |
| 805 nm NIR | 31.0 | 1.86 |
| Combined ‡ | ~58 | ~3.48 |
‡ Combined mode is derived — the red and NIR channels are characterized independently using wavelength-specific calibration, and combined output is calculated from the two measured channel values rather than measured simultaneously.
Measurement uncertainty of ±3.6% is consistent with calibrated laboratory optical power measurements, not a consumer estimate.
What that means for a session
Time to reach a target dose
Based on the measured output above. Not a usage recommendation — protocols vary by application.
| Mode | 10 J/cm² | 20 J/cm² |
|---|---|---|
| 660 nm red | ~4.2 min | ~8.4 min |
| 805 nm NIR | ~5.4 min | ~10.8 min |
| Combined ‡ | ~2.9 min | ~5.8 min |
Output stability
Output stays calibrated for the entire session
Dose equals irradiance × time. If irradiance drifts during a session, the dose actually delivered drifts with it — even if the timer says the session finished on schedule. The charts below show irradiance held essentially flat for a full session, the result of thermal characterization most consumer devices skip entirely.

Red (660 nm), 10-minute session. Mean: 39.64 mW/cm², within ±2% throughout.
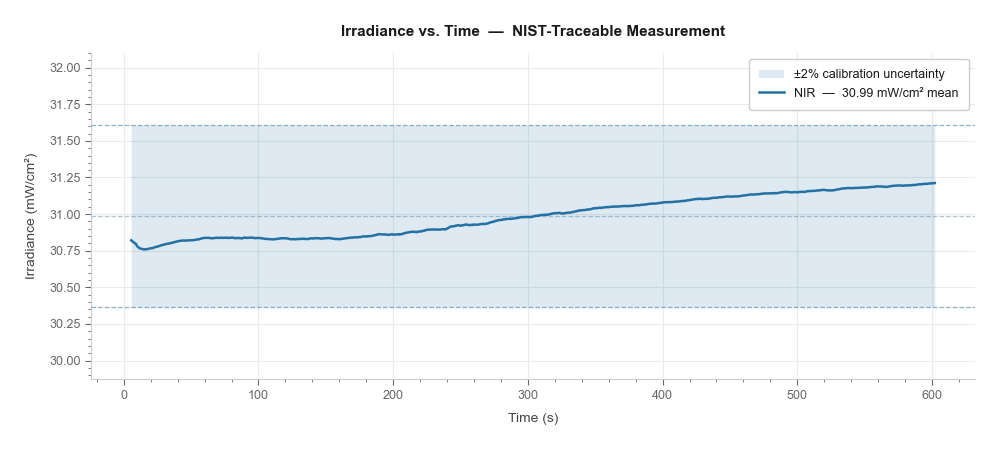
NIR (805 nm), 10-minute session. Mean: 30.99 mW/cm², within ±2% throughout.
For the technically curious
Full methodology, thermal data, and EMC notes
Wavelengths
- 660 nm red — emission bandwidth ~20–30 nm FWHM, typical of high-power red LEDs
- 805 nm NIR — emission bandwidth ~25–35 nm FWHM, typical of high-power NIR LEDs
Measurement geometry and instrumentation
Optical power density was measured using a Thorlabs PM100D power meter with an S121C photodiode sensor (400–1100 nm, 500 mW range). The S121C carries NIST-traceable calibration.
- Sensor positioned normal to the emitting surface at near-contact distance, using a calibration fixture for repeatable geometry
- Aperture-averaged irradiance — measured at multiple locations across the emitting window
- Red and NIR measured independently; wavelength set to 660 nm and 805 nm respectively on the meter
- Red channel derated ~10% from full power; NIR derated ~9% — this is the typical operating point, sustained across a session
- Combined mode is a derived estimate (summed channel output minus an I²R loss correction), not a direct measurement
- All measurements taken after thermal stabilization
Thermal behavior
Thermal management is passive — no active cooling, no cooling interval required between sessions under typical use.
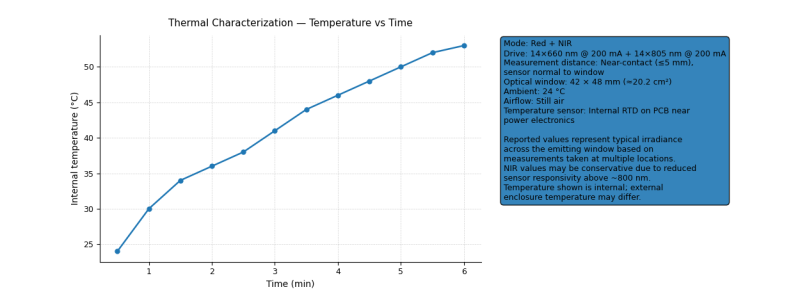
Internal temperature vs time, combined mode. Reflects steady-state thermal behavior under near-contact use.
Electrical and electromagnetic
The device contains no intentional RF transmitters during operation. Internal switching regulators and control electronics operate below audible frequencies and are confined within the enclosure. No claims of regulatory compliance or electromagnetic certification are made.
Regulatory context and important notes
Rejuvulite is designed and presented as a consumer wellness device and is not marketed as a medical device. No claims are made regarding diagnosis, treatment, cure, or prevention of disease. Individual experience may vary depending on distance, duration, and usage pattern.
The measurements on this page characterize device behavior under defined conditions and do not constitute certification, regulatory approval, or compliance testing. General principles from established safety and performance standards were considered as reference points only, including:
- Electrical and mechanical safety practices commonly applied to consumer electronics
- Photobiological safety concepts related to wavelength, exposure, and thermal behavior
- Electromagnetic compatibility considerations relevant to battery-powered electronic devices
Formal testing against regulatory standards (e.g., FDA medical device regulations, IEC medical standards, FCC emissions limits) has not been conducted unless explicitly stated. This information is provided for transparency and does not imply regulatory classification or clearance.